Comprehensive Metrics Guide for Delivery and Change Management

Comprehensive Metrics Guide for Delivery and Change Management
In enterprise environments, effective delivery and change management rely on data-driven insights. Metrics serve as the foundation for assessing performance, identifying bottlenecks, and ensuring alignment with strategic goals. This guide covers core metrics across delivery pipelines, change processes, and overall value realization, with practical steps for implementation.
Why Metrics Matter in Delivery and Change
Metrics transform subjective opinions into objective data, enabling teams to:
- Track progress against objectives
- Predict and mitigate risks
- Optimize resource allocation
- Demonstrate ROI to stakeholders
Without robust metrics, organizations risk siloed efforts, prolonged downtimes, and failed transformations.
Core Delivery Metrics
1. Deployment Frequency
Measures how often code is deployed to production.
- Target: Daily or multiple times per day for elite performers (DORA standards)
- Calculation: Number of deployments per day/week/month
- Practical Steps: Integrate deployment tracking into your CI/CD pipeline; segment by environment (dev/staging/prod); benchmark against industry standards
2. Lead Time for Changes
Time from commit to production deployment.
- Target: Less than one day
- Calculation: Average time across all changes
- Practical Steps: Use tools like GitHub Actions or Jenkins for automated logging; identify delays in review, testing, or approval stages; automate where possible to reduce human bottlenecks
3. Change Failure Rate
Percentage of deployments causing failures in production.
- Target: 0–15%
- Calculation: (Failed changes / Total changes) × 100
- Practical Steps: Define “failure” such as rollback, hotfix, or degraded service >1hr; implement canary releases and feature flags; conduct post-mortems on failures
4. Mean Time to Recovery (MTTR)
Average time to restore service after a failure.
- Target: Less than one hour
- Calculation: Total downtime / Number of incidents
- Practical Steps: Set up alerting with PagerDuty or Opsgenie; automate rollback procedures; run chaos engineering drills
Key Change Management Metrics
1. Change Success Rate
Proportion of changes implemented without issues.
- Target: >85%
- Calculation: (Successful changes / Total changes) × 100
- Practical Steps: Standardize change request templates; require risk assessments and peer reviews; track via ITSM tools like ServiceNow
2. Change Volume and Backlog
Number of changes processed vs. pending.
- Target: Backlog <10% of monthly volume
- Calculation: Pending changes / Total submitted
- Practical Steps: Prioritize using the MoSCoW method; implement change advisory boards (CAB); monitor cycle time from request to approval
3. Emergency Change Percentage
Ratio of urgent changes to total changes.
- Target: <10%
- Calculation: (Emergency changes / Total) × 100
- Practical Steps: Analyze root causes of emergencies; shift to proactive maintenance; enforce post-change reviews
Value Realization Metrics
1. Business Value Delivered
Quantifies impact of changes on key outcomes.
- Examples: Revenue uplift, cost savings, user engagement
- Calculation: Pre/post change KPIs delta
- Practical Steps: Tag changes with expected business outcomes; use OKR frameworks for alignment; report quarterly value scorecards
2. Customer Satisfaction (CSAT)
Feedback on delivered changes.
- Target: >4/5 score
- Calculation: Average post-deployment survey score
- Practical Steps: Automate NPS/CSAT surveys; correlate with deployment metrics; iterate based on qualitative feedback
Implementing a Metrics Framework
- Select Metrics: Start with DORA’s four key metrics, then add change-specific ones.
- Tooling: Use observability platforms such as Datadog or New Relic integrated with ITSM.
- Dashboards: Build real-time views in Grafana or Tableau.
- Benchmarking: Compare against industry peers via the Accelerate State of DevOps report.
- Review Cadence: Weekly team reviews and monthly leadership updates.
- Action Loops: Tie metrics to retrospectives and PI planning.
Common Pitfalls and Best Practices
- Pitfall: Vanity metrics such as lines of code — focus on outcomes.
- Best Practice: Context matters; segment by team/service.
- Pitfall: Overloading with metrics — limit to 7–10 core ones.
- Best Practice: Automate collection to ensure accuracy.
Regularly refine your metrics to reflect evolving priorities. For enterprise-scale success, integrate these into your reference models for delivery and change.
Related Articles

A Practical Monorepo Architecture with Next.js, Fastify, Prisma, and NGINX
Explore a practical monorepo architecture using Next.js, Fastify, Prisma, and NGINX, highlighting real-world integration and workflow.

Search Engine Optimization: The reliable workflow for Top-Rankings
Detailed analysis of search engine optimization (SEO), its technical foundations, the role of web crawlers, and the strategic steps to achieve organic top rankings.

Drag-and-Drop with JavaScript: A Deep Analysis of the Native API for Interactive Menu Structures
Implementing drag-and-drop functionality is crucial for modern, interactive user interfaces. This article examines the technical implementation using the native HTML5 Drag-and-Drop API in Vanilla JavaScript and TypeScript, focusing on the creation of dynamic menu structures.
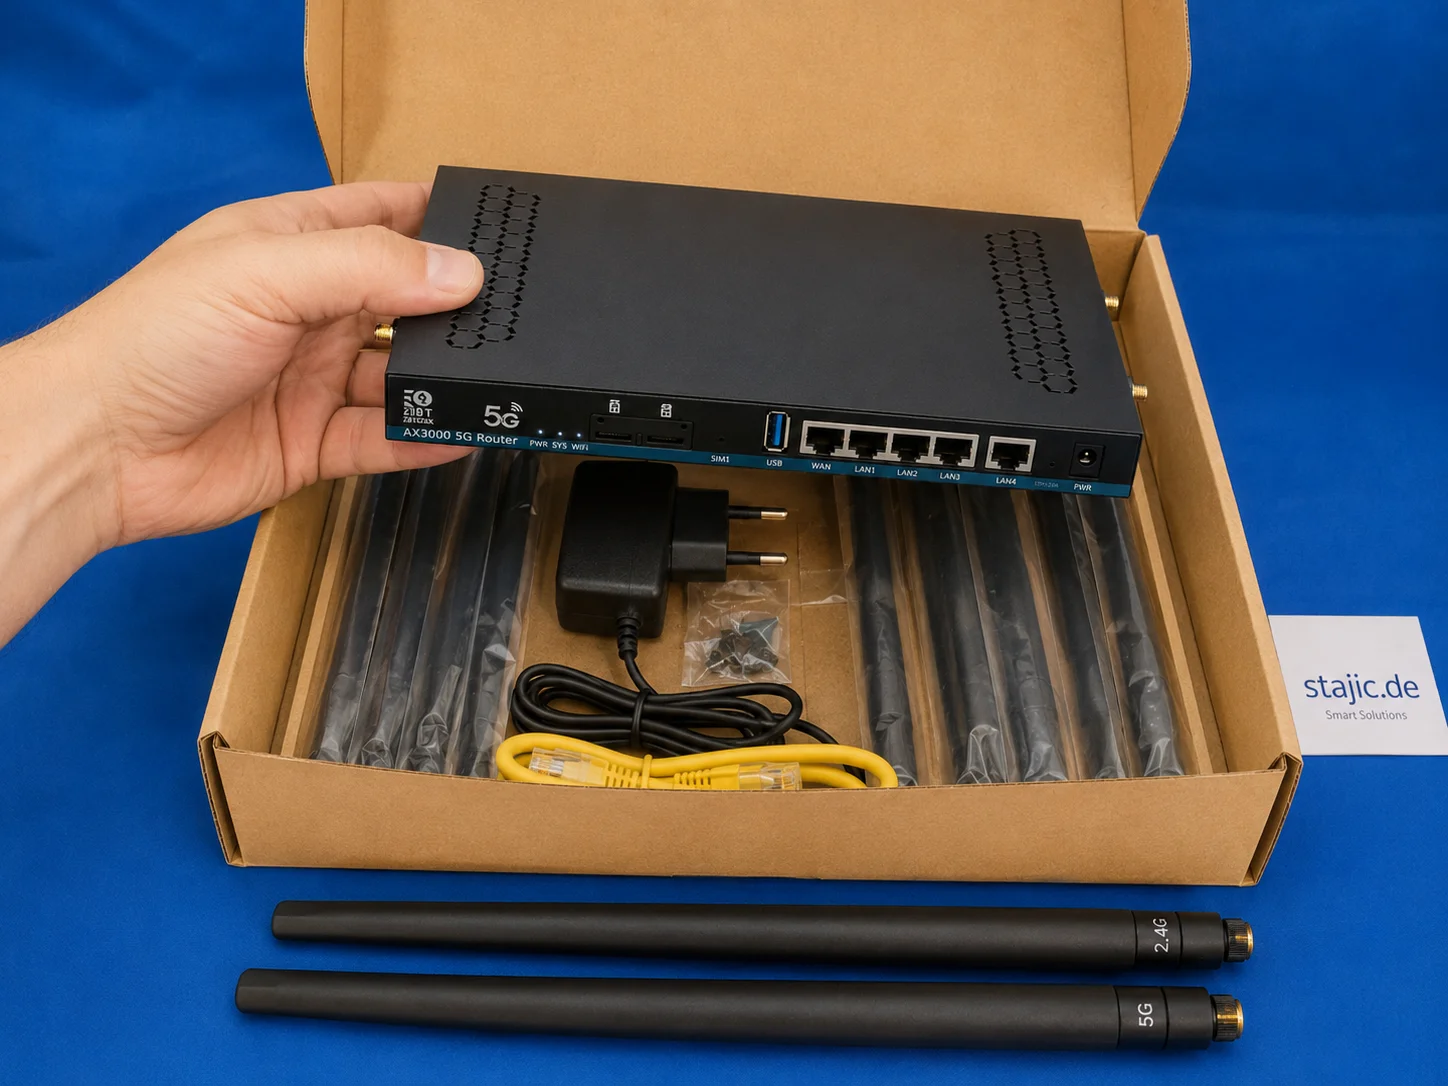
ZBT Z8102AX Hardware and Packaging Review: Strong Router, Weak Box
The ZBT Z8102AX makes a solid first impression as a slim black metal 5G OpenWrt router with multiple antenna connectors, dual-SIM slots, USB, LAN/WAN ports and a practical accessory set. The hardware feels useful and serious, but the packaging is clearly the weak point.

Front- and Backend Development
Front-end and back-end development is an essential part of web development and involves the creation of web applications and websites. Front-end development focuses on the user interface, while back-end development is responsible for programming and managing the server side.
javascript-batchverarbeitung-oder-stapelverarbeitung-von-function

Qwen 3.6 in Production: Release Runbook, AI Rollback, and LLMOps Versioning
Qwen 3.6 is not just another model upgrade. It is a release event, a rollback scenario, and a versioning problem at the same time. This article explains how Qwen 3.6 should be handled in production through LLMOps discipline, prompt and model traceability, controlled rollout, and evidence-based rollback readiness.

erstellen-eines-benutzerdefinierten-gpt-4-plugins-in-wordpress

Should You Buy a 5G OpenWrt Router with Old Firmware? ZBT Z8102AX as a Practical Example
Buying a 5G OpenWrt router with older firmware can make sense, but only under the right conditions. The ZBT Z8102AX shows both sides clearly: the hardware is useful, the modem works, and the router stayed stable in testing, but OpenWrt 21.02, weak packaging and unclear upgrade paths require a careful buying decision.

How to Install PHP 8.3 on Ubuntu 22.04
Up-to-date guide on installing PHP 8.3 on Ubuntu 22.04, including Apache and Nginx (PHP-FPM) integration, extensions, and running multiple PHP versions side by side.